At this time of the year, I would usually be travelling with my family in order to escape our mundane routines. Last year, we did a Central Europe tour and two years ago, we visited Turkey and spend some time in Athens, Mykonos, and Santorini. However, due to the widespread of Coronavirus, Malaysia is under lockdown and all I can do is stay at home reminiscing about my past travel experience.
I created a travel blog last year; it makes reminiscing easier and fun. Instead of a wall of text, I decided to present all of the places I’ve been to on a map with short commentaries on it. More on the design and development process later in another post. I want to focus a little bit on performance since I notice how terribly slow the rendering performance of the map on mobile.
Slow rendering, janky animation, and a poor lighthouse score are some of the problems I’m dealing with.
With nothing better to do during the lockdown, I decided to document my process of improving the map rendering performance as I found myself changing more than just code in order to speed up the page.
Use layers instead of markers
Initially, I had opted to use markers instead of layers since it gives me the opportunity to work with my bread-and-butter, which is HTML/CSS instead of Canvas syntax. I can do a wee bit of Canvas if need be but I just want the development process to be faster instead of spending time learning things. And here lies the first bane of web performance: laziness. Imagine all of the libraries that are being installed just to get things done quickly without thinking about the impact on bundle size and JS evaluation time. I’m guilty of this too. It is not necessarily laziness that contributes to this. We have deadlines to honor.
Layers are a better choice since you can combine them into a single layer instead of having to render individual markers. There are several strategies to go about this depending on your needs and I tried several methods to get a result that I’m happy with. Several things I’ve tried:
- Keeping it simple by using a single symbol layer
- Use two layer types in order to render the circle and text
- Use two layer types and play with zoom levels
There’s quite a significant performance improvement that I gained just by converting HTML markers to layers. Though First Contentful Paint (FCP) seems to degrade but there are significant improvements to Time to Interactive and First CPU idle.

Keeping it simple by using a single symbol layer
I decided to start by converting all of my markers into a single symbol layer. The technique is simple enough and I also manage to animate the layer in order to achieve the original pulsing effect of the first version thanks to a tutorial by the Mapbox team. However, this technique doesn’t cut it for me since not all of the symbols are rendered when you zoomed out.
Only two of the symbols showed up when you zoomed out. Zooming in will display more of the symbols.
This behavior does not apply to symbols without any text on it. Mapbox does render all of the symbols if you set icon-allow-overlap: true. If you want to show the text without any rendering limit imposed on zoom level, you can set text-allow-overlap: true but the result is ghastly.
Definitely not what I was going for…
I wanted to show all of the symbols so that people can see the distance I’ve covered in an itinerary at a glance. Since symbols doesn’t seem to be the best choice at this point, I decided to try out the circle layer.
Use two layer types in order to render the circle and text
I’ve created two layers which is the circle and symbol layer. The symbol layer will be rendering the text data of the circle. I manage to get something close to what I was looking for but it is still not ideal as there are numbers that are hidden by the border of the circle and it doesn’t look good.
I think this look slightly better than the overlapping text effect but it is still not what I want.
Use two layer types and play with zoom levels
At this point, I think it was important to re-think the experience and figure out the alternative. I decided to take some inspiration from BusRouter SG (built by the amazing Chee Aun). I decided to show blank pink circles when zooming out and only show the numbered ones on zoomed in.
I like the solution because I manage to achieve my original goal, which is to show my “footprints” on the map when it is zoomed out while maintaining a decent performance.
Not what I had in mind but I’m happy with this.
Remove unnecessary animation on first render
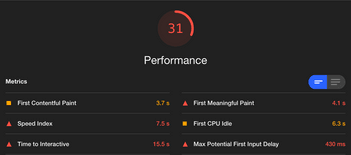
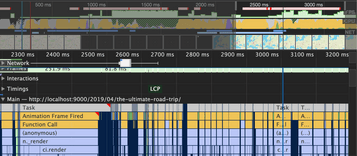
With the markers successfully converted into layers, I’ve decided to look for other opportunities to speed up the page load. Looking at the flame graphs on the performance tab, it shows me that the starting animation is a big bottleneck.

So as an experiment, I decided to remove it. This actually improves the performance score tremendously. We went from 31 to 58 overall performance score on lighthouse!

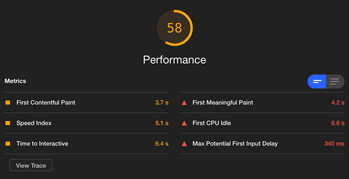
The animation contributes to some really heavy script evaluation work. Removing it results in a dramatic decrease in time to interactive as well as first CPU idle.
I had use the flyTo animation that was triggered immediately after the map loaded. I figured that it is not necessary to animate the map and I didn’t do it for any strong reason other than aesthetic. I was happy to toss that out without finding a fallback solution.
Beyond Mapbox optimization
At this point, I don’t think so I can do much in optimizing Mapbox rendering performance. I consider using vector tileset sources instead of GeoJSON data but the performance gain is negligible for a small dataset such as mine. Using the correct data source is more relevant if you’re dealing with larger datasets.
I started looking for other places where I can optimize the page even more. My FCP timing isn’t too impressive at this point so I decided to optimize that even further.
Render content immediately
I had blocked the entire page with a spinner in order to ensure that content will only show once the map is loaded. I made this decision in order to block any interaction from the user because the experience of the interaction heavily depends on the map. Obviously, this hurts the FCP timing. In hindsight, it wasn’t really a good decision since Mapbox loading could fail for any reason and the content will never be rendered.
I decided to drop the spinner and just serve the content immediately regardless of the map’s loading condition. Doesn’t matter if the map loads slowly or if it failed or succeed. People should be able to see content as soon as possible and interact with it.
Defer image loading until it is needed
I was requesting a high number of images on the first render so I let Lazysizes do all of the hard work for me and ensure that image is loaded only when it is needed.

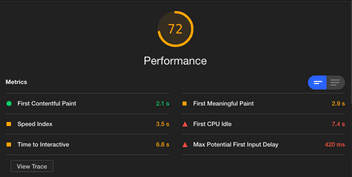
With all of these extra steps I’ve taken in order to speed up the page on mobile, I ended up with a decent lighthouse score. Perhaps it is not blazingly fast but it is a significant improvement to the initial score.